Monitoring Campaigns
You can monitor the progress or the progress of your campaigns from the Stats tab:
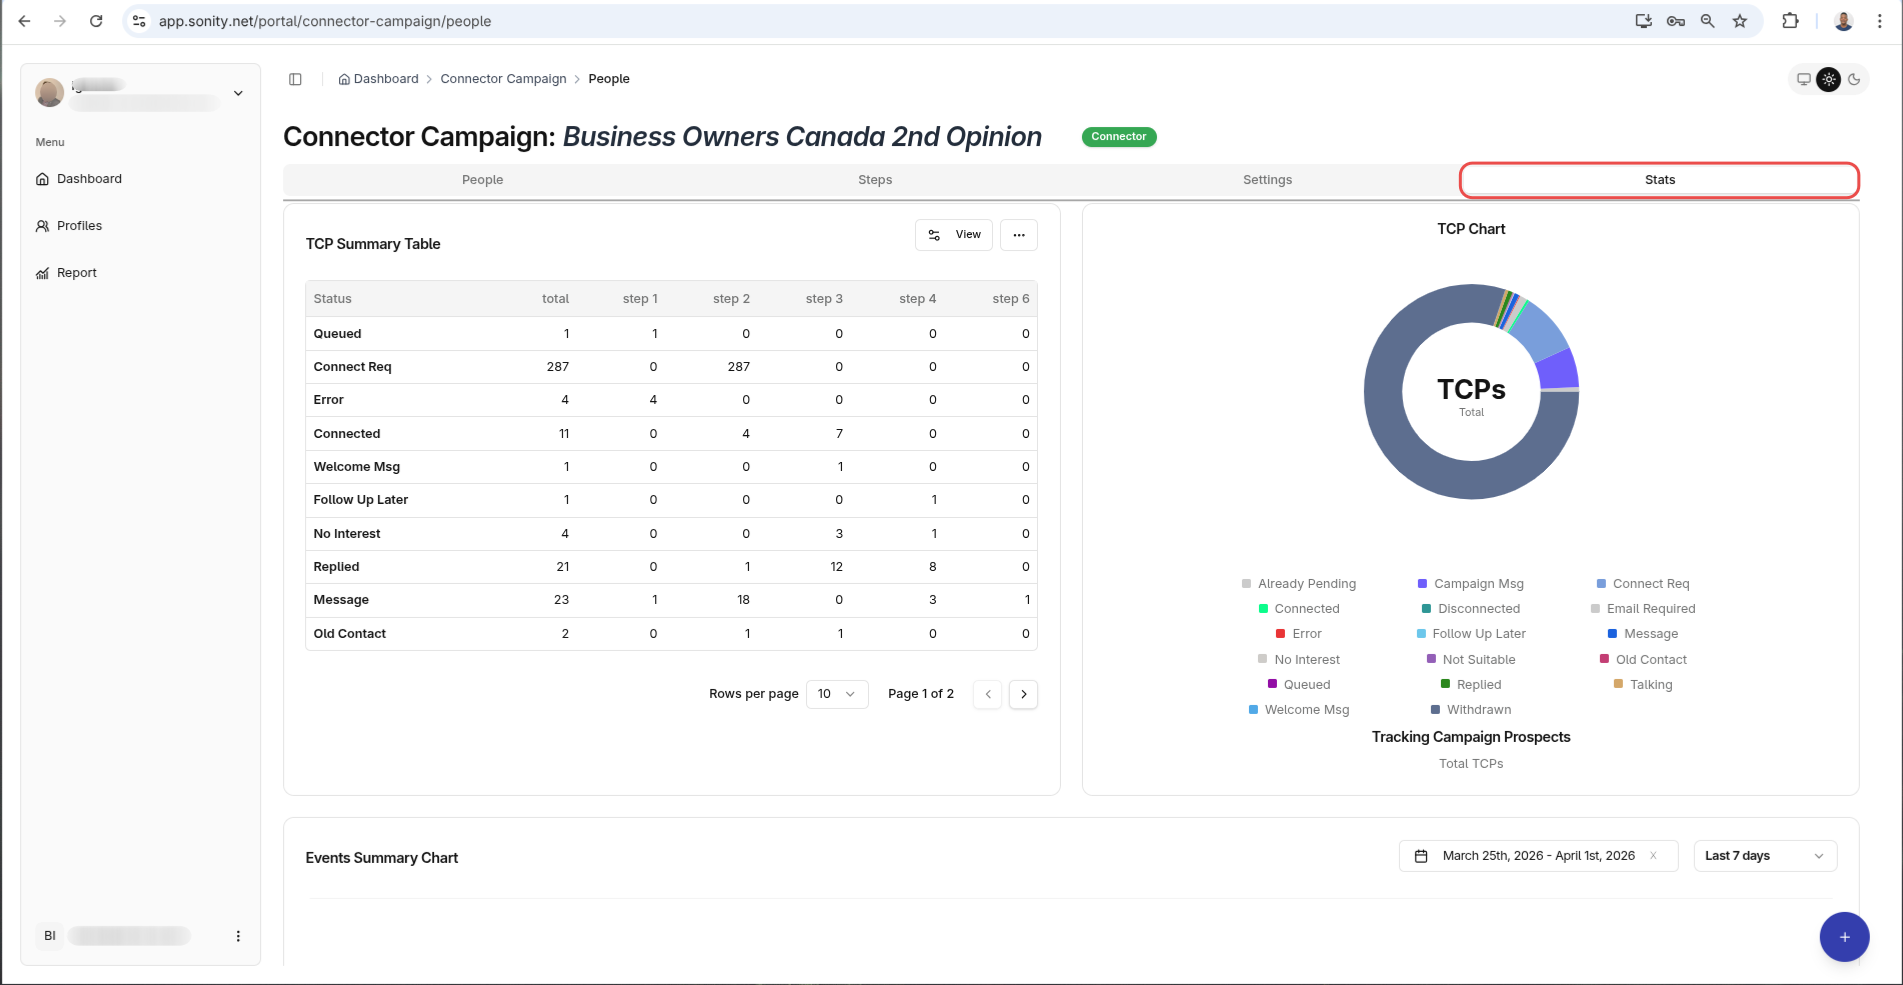
Top Reports
TCP Chats
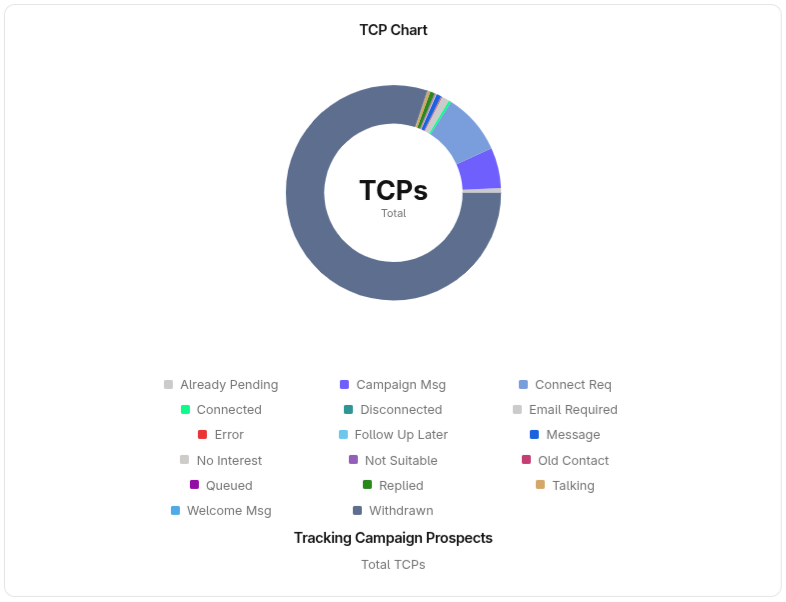
The TCP Chart shows you the status of your prospects as a Pie chart.
For example the chart below shows that many prospects are in Withdrawn status, followed by Connect Requests then Message status
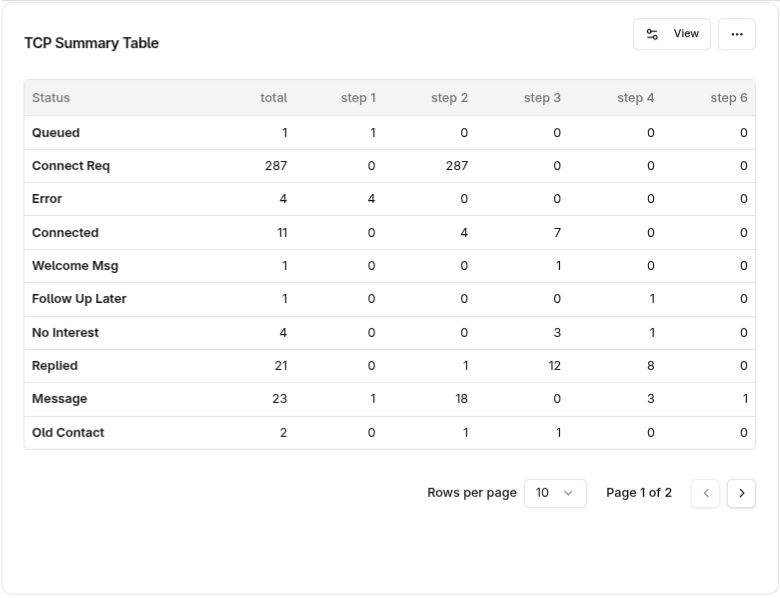
TCP Summary Table
The TCP Summary Table show the status of your prospects but in more detail.
Bottom Reports
In the bottom chart we have Events chart and the Metric gauges
1. Events Charts
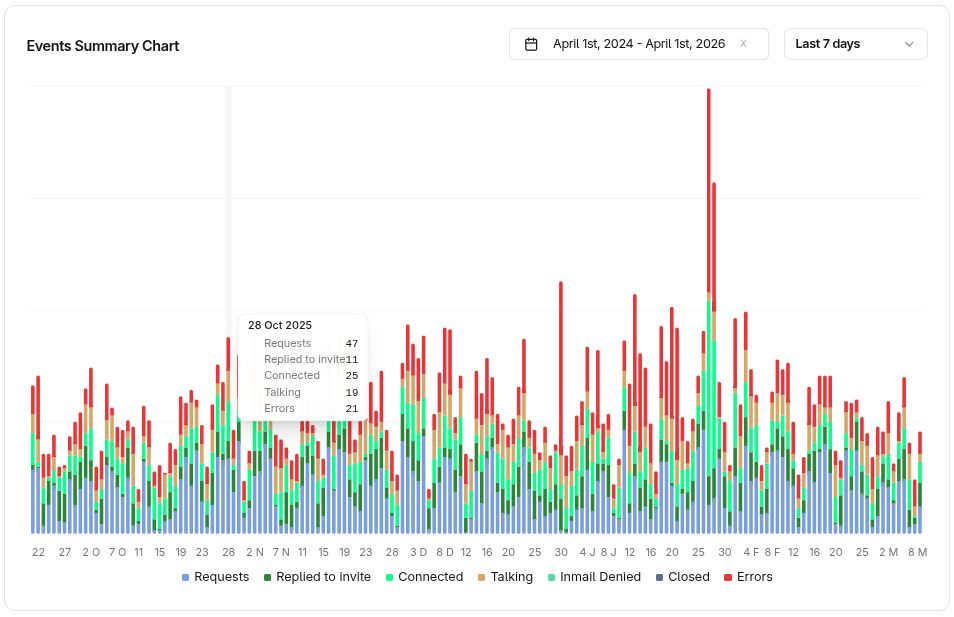
Its a bar chart that shows prospect statuses by date. For example on 12 December 2024, 10 prospects were in Connect Req Status, 40 prospects were in Message status, 5 were in Withdrawn status.
The Time Of Operation gives you fine grained control over the time of the Events chart
2. Metric Gauges
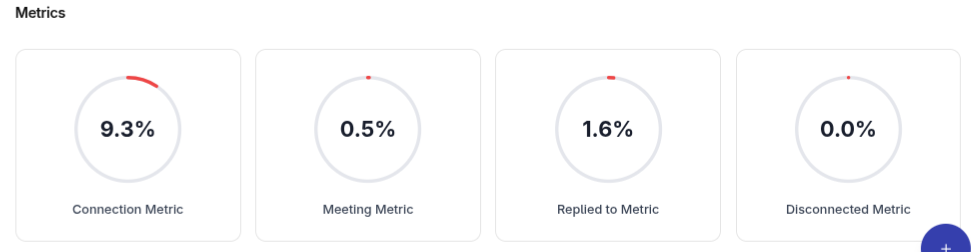 Metric gauges gives you a percentage of the metric in question. For example a Connection metric of 25% tells that out of 200 contacts, 50 contacts connected successfully.